
Spot KPI deviations in your Obeya dashboard before the meeting
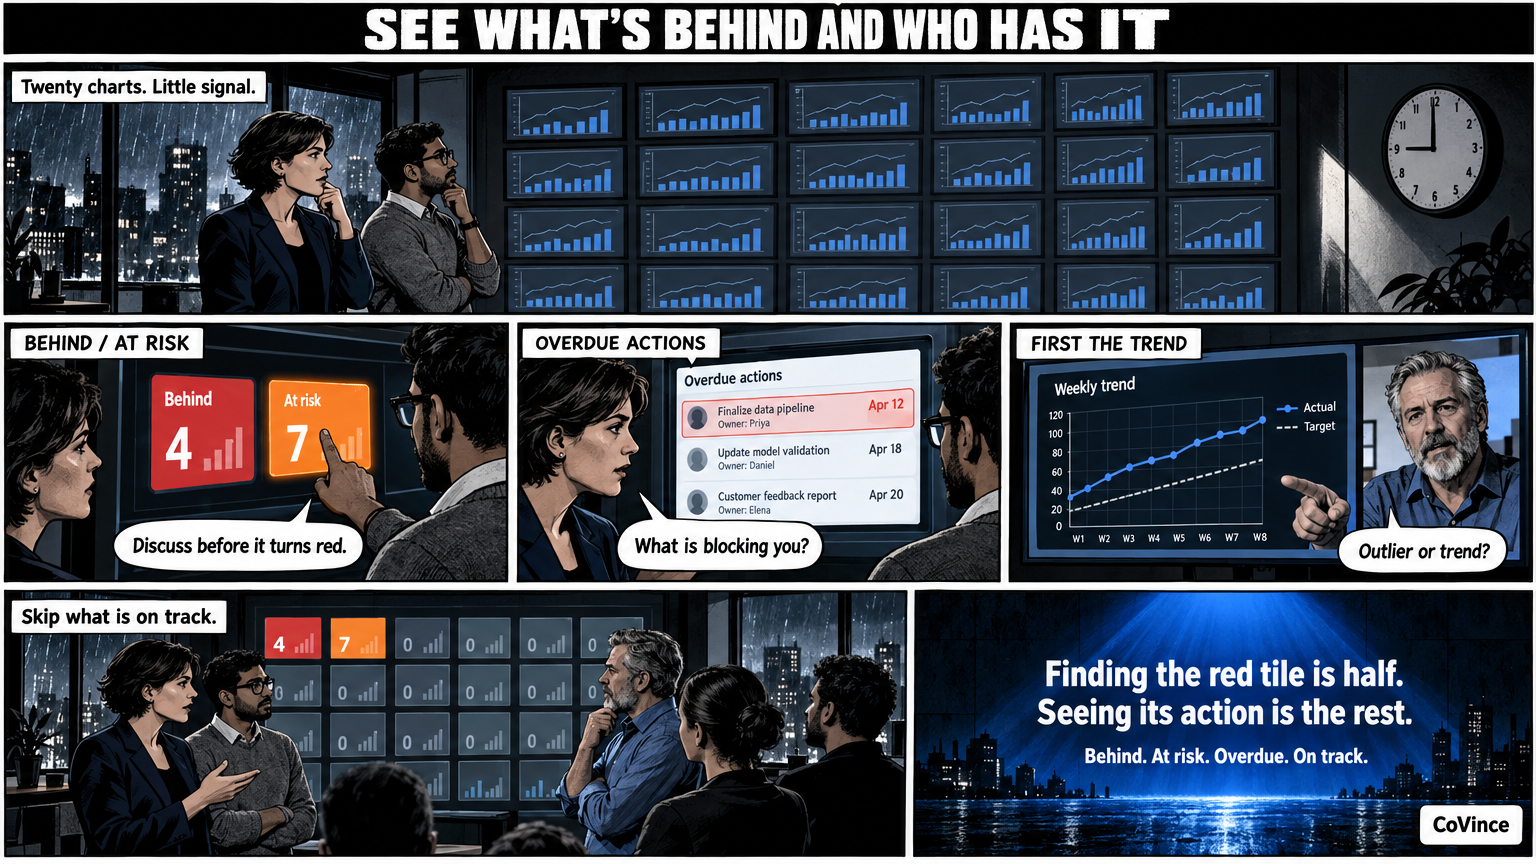
A KPI deviation in your Obeya dashboard is easiest to see when the wall itself says what needs attention. In CoVince four statuses show that at a glance: behind, at risk, late actions and on track. Tap one and you see only those tiles, with the action and the owner per tile.
The problem: too many numbers, too little signal
A wall with twenty charts looks impressive and says little. The team has to walk past every tile to discover which one does not look right, and the stand-up is spent on looking instead of deciding. Spotting a deviation is therefore not finding the red tile, but going quickly to the red tile and seeing right away what is being done about it.
The four statuses
| Status | What it says | What you do with it |
|---|---|---|
| Behind | The number is behind the target | Look at the trend: an outlier or a trend? |
| At risk | The number risks falling behind | Discuss it early, before it is red |
| Overdue actions | An action has passed its date without being done | Ask the owner: what is blocking, or is the date different? |
| On track | The number is at or above target | Do not discuss, unless the team wants to learn something |
At the top of the board it shows how many numbers are behind, at risk or on track, and how many actions are overdue. Tap one of the four and you see only those tiles. That way the stand-up starts with what needs attention, and the team skips what is on track.
First the trend, then the cause
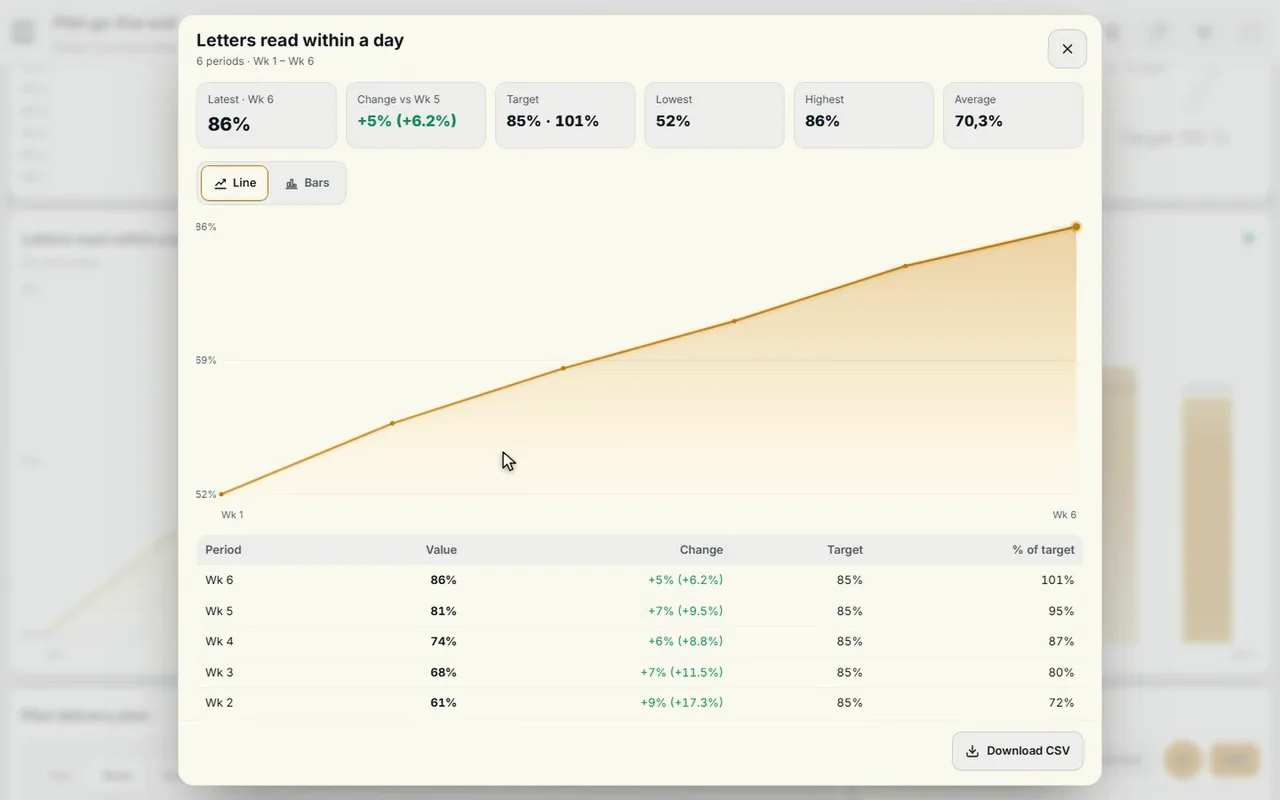
A red number does not yet say why. Tap the tile and you see the trend per week, against the target, with the latest value, the change and the lowest and highest point. That makes the difference between an outlier and a trend, and between a problem you have to solve now and one you keep an eye on.
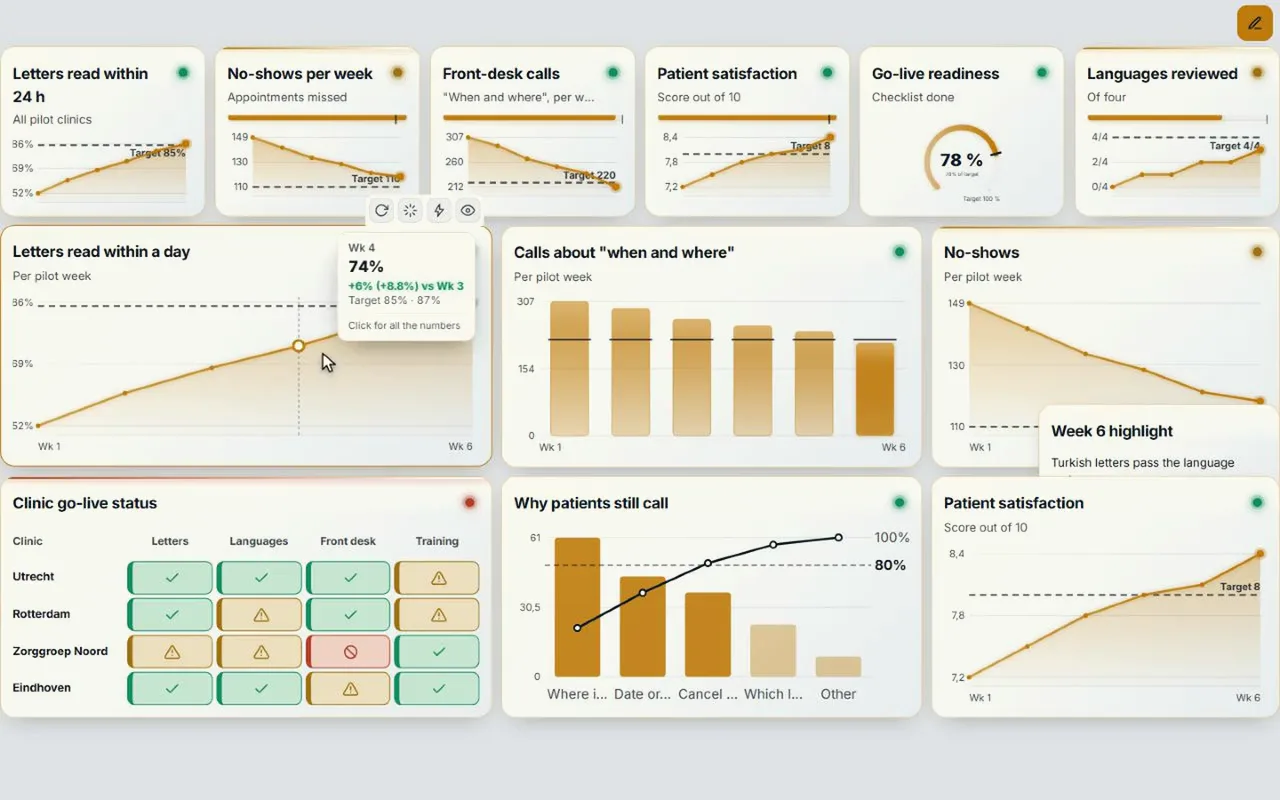
A Pareto chart, which you can also put on the board, helps with the next question: where does it come from? If seventy percent of the deviation lies with two causes, you know where to start.
An action for every deviation
A deviation without an action is an announcement. In CoVince the action hangs on the board it is about: tap a chart and you see which action is attached to it. Every action has an owner and a date, and stays visible on the board and on the timeline until it is done. A red tile without an action is thus a signal too: nobody is responsible yet.
The CrewMate as a second pair of eyes
The CrewMate knows the board. You can ask it out loud:
- What is behind?
- Which actions are overdue, and whose are they?
- What has changed since the last stand-up?
It answers from what is on the board, and proposes what you can do about it: an action with owner and date, which you confirm. That is handy when there are more tiles than the team can look at in fifteen minutes. The decision stays with the team. And because it reads from the board, its answer is only as good as the number: if a source lags, the answer lags.
A fixed rhythm for deviations
- Daily: open on ‘behind’ and ‘overdue actions’. For each red number: an owner and a date.
- Weekly: look at ‘at risk’. What threatens to turn red, and what do we do about it?
- Per period: check whether the goals are still right. A number that is always red may have the wrong target. A number that is always green probably shows nothing.
Pitfalls
- A KPI without a target. Then nobody knows whether 86 is good or bad.
- Too many KPIs. Five to eight is a good starting point. Anything that does not drive a decision or has no owner comes off.
- Red as failure. If red raises a question of blame, the team hides the problems. Make it a norm that red is the reason to look together.
- Outdated source. A number that does not refresh signals nothing.
For a fuller overview of the dashboard see Obeya dashboard: KPIs that tell you what is wrong. Examples of walls per sector are in KPI wall examples.
An example: from red to action in four steps
Suppose a KPI on Meridiaan Health’s board is red. This is how the team walks through it.
- Open the number. The trend per week shows it is not an outlier, but a trend of three weeks.
- Find the cause. The Pareto chart shows that most of the deviation lies with one or two causes.
- See whether there is already an action. Tap the chart. There is none attached.
- Make the action. Sanne takes it, with a date. Next stand-up it is at the top under ‘behind’ or under ‘overdue actions’ if it is not done.
That is the whole method: the wall points to the deviation, the team looks at the trend and the cause, and an action with an owner appears.
Frequently asked questions
How do I quickly see which KPIs deviate?
At the top of the board it shows how many numbers are behind, at risk or on track, and how many actions are overdue. Tap a status and you see only those tiles.
What is the difference between behind and at risk?
Behind means the number is already behind the target. At risk means it threatens to fall behind. That way you discuss it early.
How do I see who has the action?
Tap a chart and you see which action is attached to it. Every action has an owner and a date.
Can the CrewMate point out deviations?
You can ask it what is behind or which actions are overdue, and it answers from what is on the board. The team decides what happens.
How many KPIs belong on the wall?
Five to eight is a good starting point. Anything that does not drive a decision or has no owner comes off.