
Obeya dashboard: KPIs that tell you what is wrong
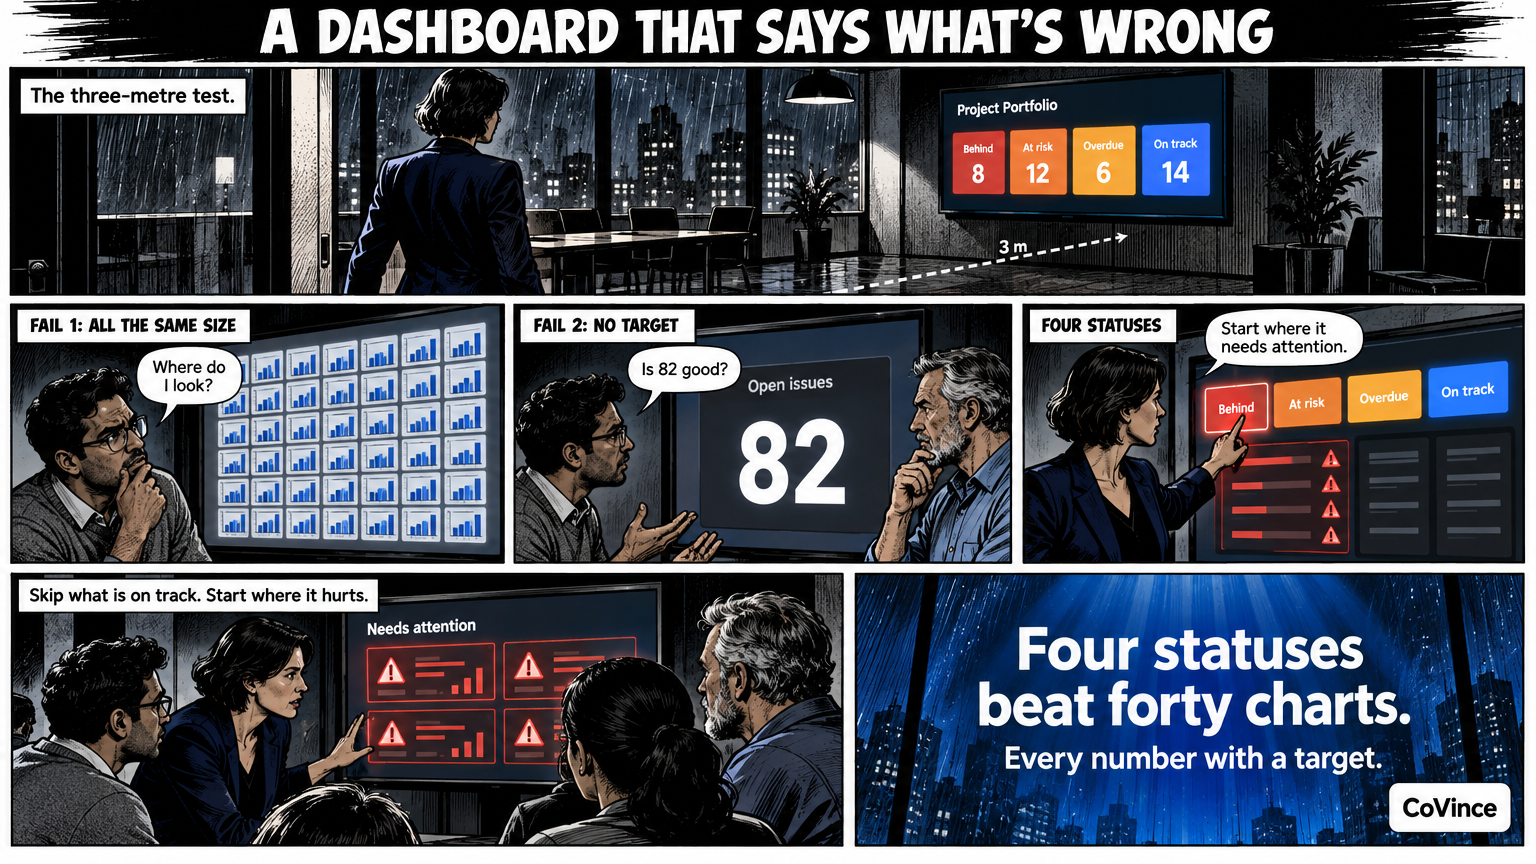
A good Obeya dashboard shows without searching which numbers are behind, which are at risk, which actions are overdue and what is on track. In CoVince’s Control Room those four counters sit at the top: tap one and you see only the tiles that need attention.
The three-metre test
A dashboard for an Obeya must be readable from three metres away, in a few seconds, while you stand with six people. That is a different requirement from a report you read at your desk. The test: can someone who has just walked in say what the conversation should be about, without anyone explaining anything?
Most dashboards fail on one of two points. Either they show everything at the same size, so nothing stands out, or they show the number without the target, so you do not know whether 82 is good or bad.
Four statuses instead of forty charts
The Control Room counts the board for you and shows four chips:
- Behind. The number is behind the target.
- At risk. The number threatens to deviate.
- Overdue actions. The number of actions that are past their date and not yet done.
- On track. What goes well, so the team also sees what works.
Tap a chip and the board filters to those tiles. So your stand-up does not start at the first tile top left, but at what really needs attention.
Every measurement has a target
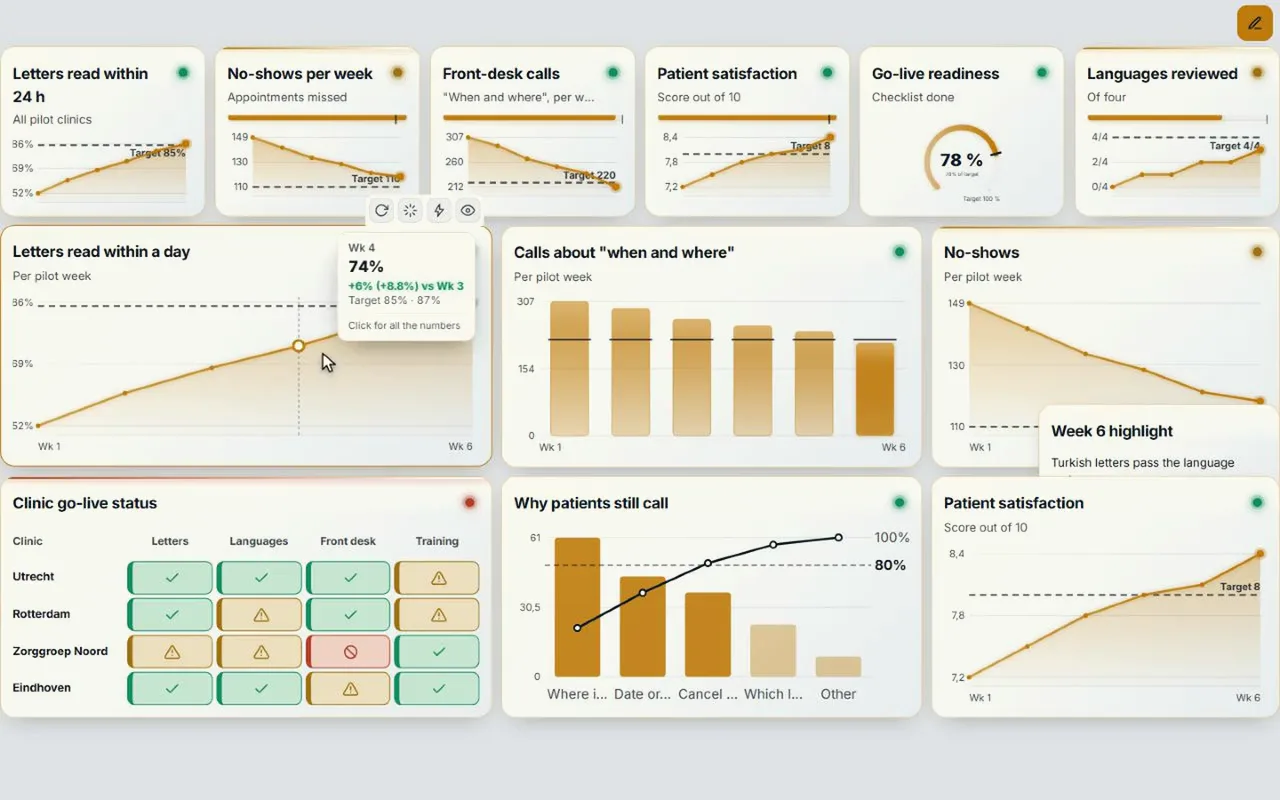
A KPI without a target is a number. Put the target with each measurement and let the tile colour: green, orange or red. Then choose per tile the shape that fits the question: a meter for a percentage against a target, a line for the trend, a bar for comparing things, a table with a status per row. The Control Room has dozens of kinds of tiles, including KPIs, meters, trends, actions, decisions, roadmap, tables and map.
Tap: from number to cause
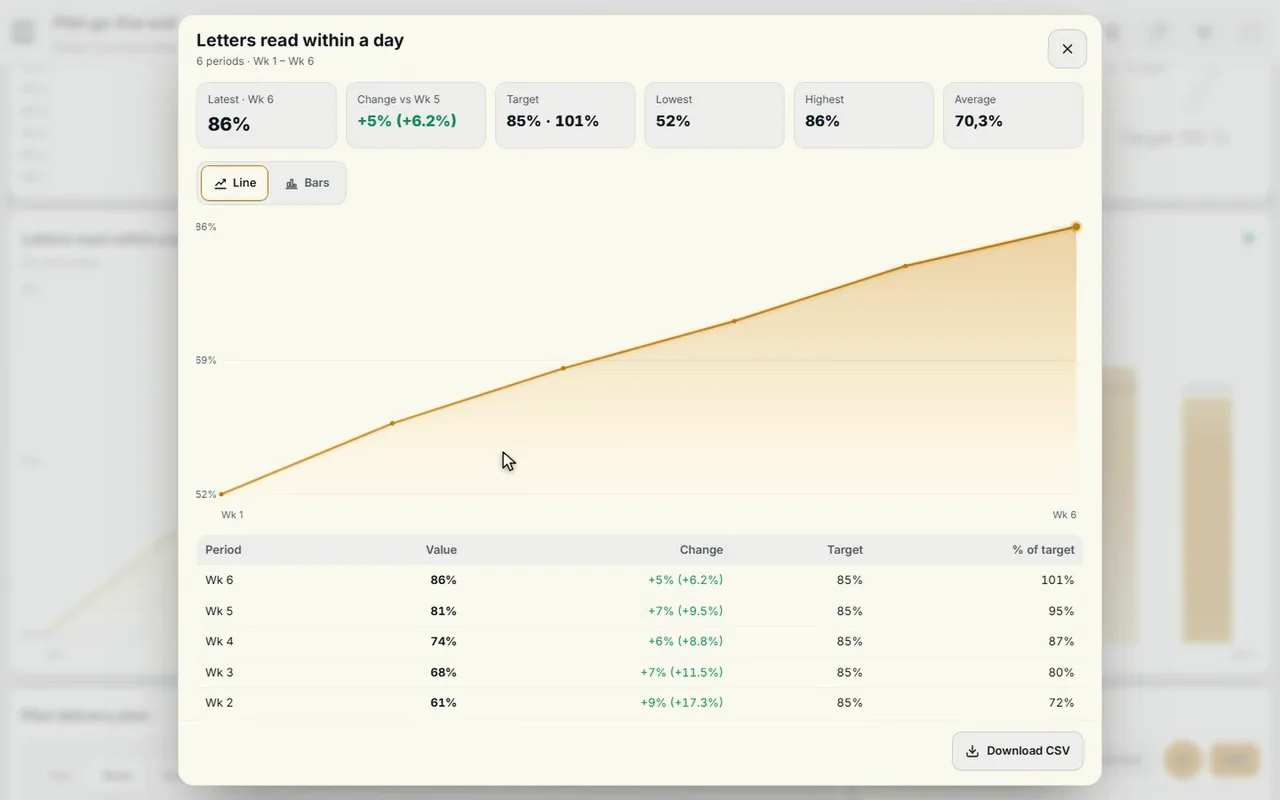
A deviation on the wall is only useful if you can ask further. Tap a tile and you see the trend per week, against the target. Tap a chart and you also see the action attached to it: who, what and by when. That way nobody has to search during the stand-up for what is already being done.
Let the CrewMate do the explaining
Whoever does not look at the board daily sometimes just wants to ask why something is red. The CrewMate reads what is on the board and answers questions about it, out loud too. It can make a chart from a sentence like ‘intake per month against the target’, using only columns that really are in your data. And when it fills in manual numbers or proposes actions, that only happens when you press Apply.
How to build such a wall
- Pick five to eight KPIs. More does not fit on one screen if you want to read them from three metres.
- Give every KPI a target and a source. From CoVince, a CSV or a connected source, or manual.
- Give every screen a name. Goals, Progress, Actions, Risks: then the team walks along the wall screen by screen.
- Link actions to deviations. A red tile without an action is an open question.
- Put it on the big screen and hold the stand-up in front of it.
The wall itself is then the conversation. You can read more about the screens and the set-up in command center without custom build. What to look for when choosing a tool is in the checklist, and the whole picture in the complete guide.
Five mistakes on a KPI wall
- Too many tiles. What you cannot read from three metres belongs on a detail page.
- No target. A number without a target says nothing about good or bad.
- No link with actions. A red tile without an action is an open question.
- Only good news or only bad news. Also show what is on track, so the team sees what works.
- Everyone sees a different board. Hang one version, the same for everyone.
Frequently asked questions
What should be on an Obeya dashboard?
Goals and KPIs with their target, a view of what is behind or at risk, the actions that are overdue, and what is on track. Anything you cannot read from three metres belongs on a detail page.
How many KPIs belong on one wall?
Pick five to eight per screen. For more, spread them over screens or pages that each have their own name, such as Goals, Progress, Actions and Risks.
What do behind, at risk, overdue actions and on track mean?
Behind: below the target. At risk: runs a risk. Overdue actions: past the date and not yet done. On track: going well. The Control Room counts them and lets you filter on them.
Can I tap a chart to see the action?
Yes. Tap a tile for the trend per week against the target, and a chart to see the action with it.
Can an AI explain my KPIs?
The CrewMate reads what is on the board and answers questions about the numbers, out loud too. What it fills in or proposes, it only applies when you press Apply.