
KPI wall examples: real walls and example KPIs per sector
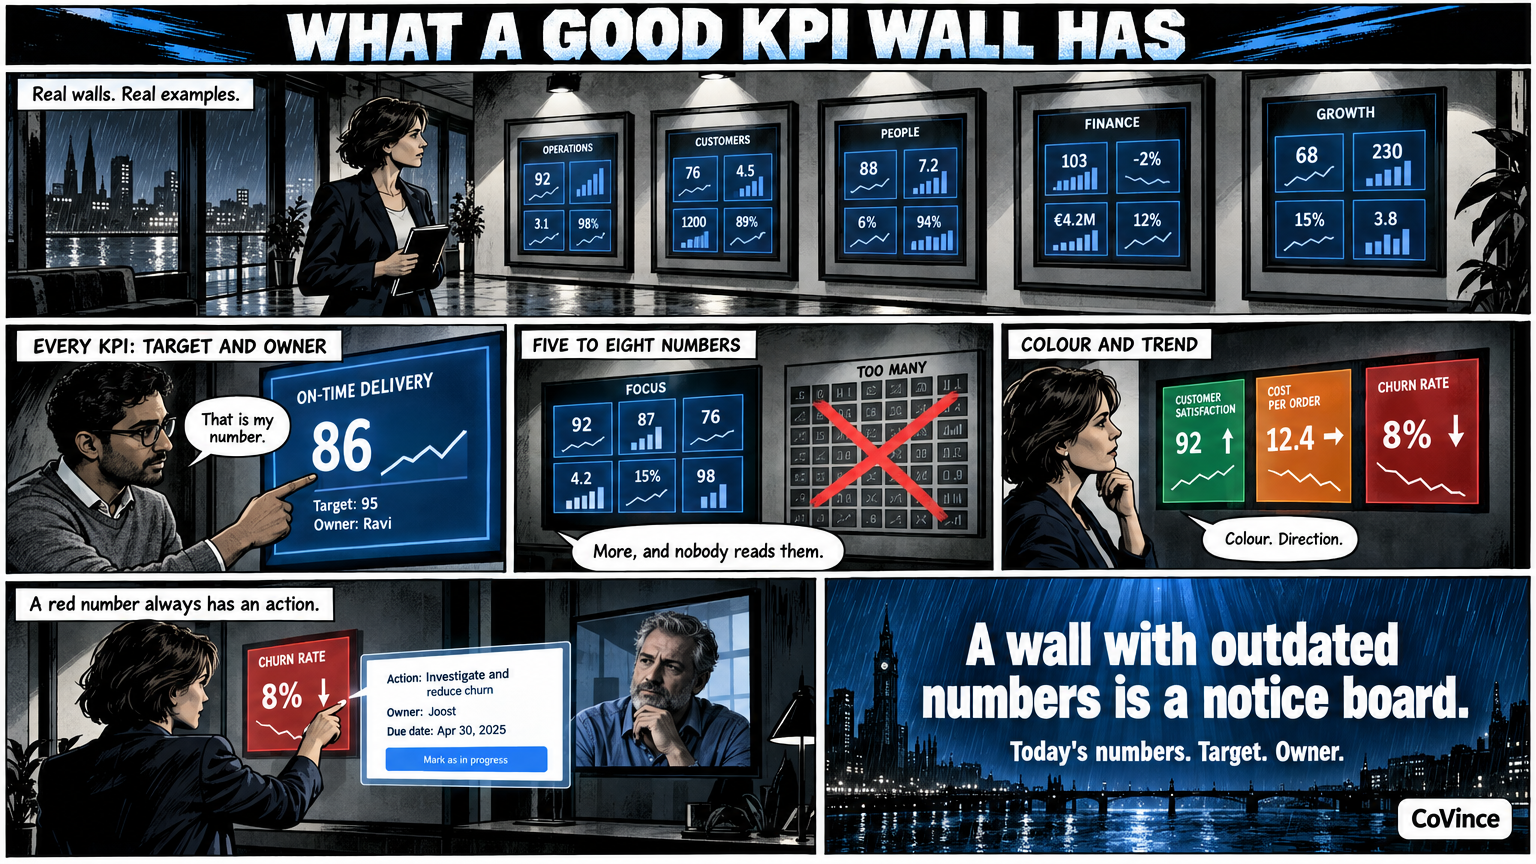
What does a good KPI wall look like? This page has real screenshots of walls in the CoVince Control Room, and per sector a list of example KPIs to choose from. The numbers in the images are demo data. Which KPIs belong on your wall is up to your team.
Real walls from the Control Room
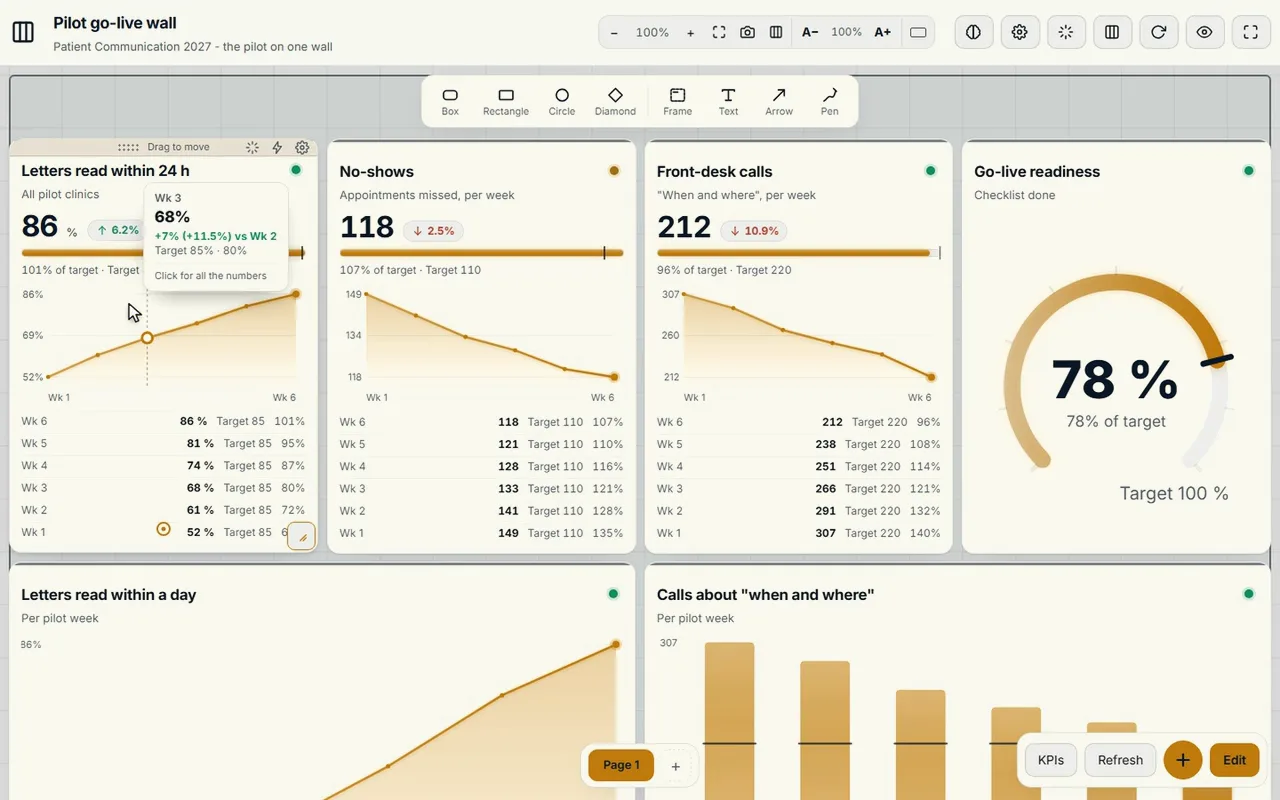
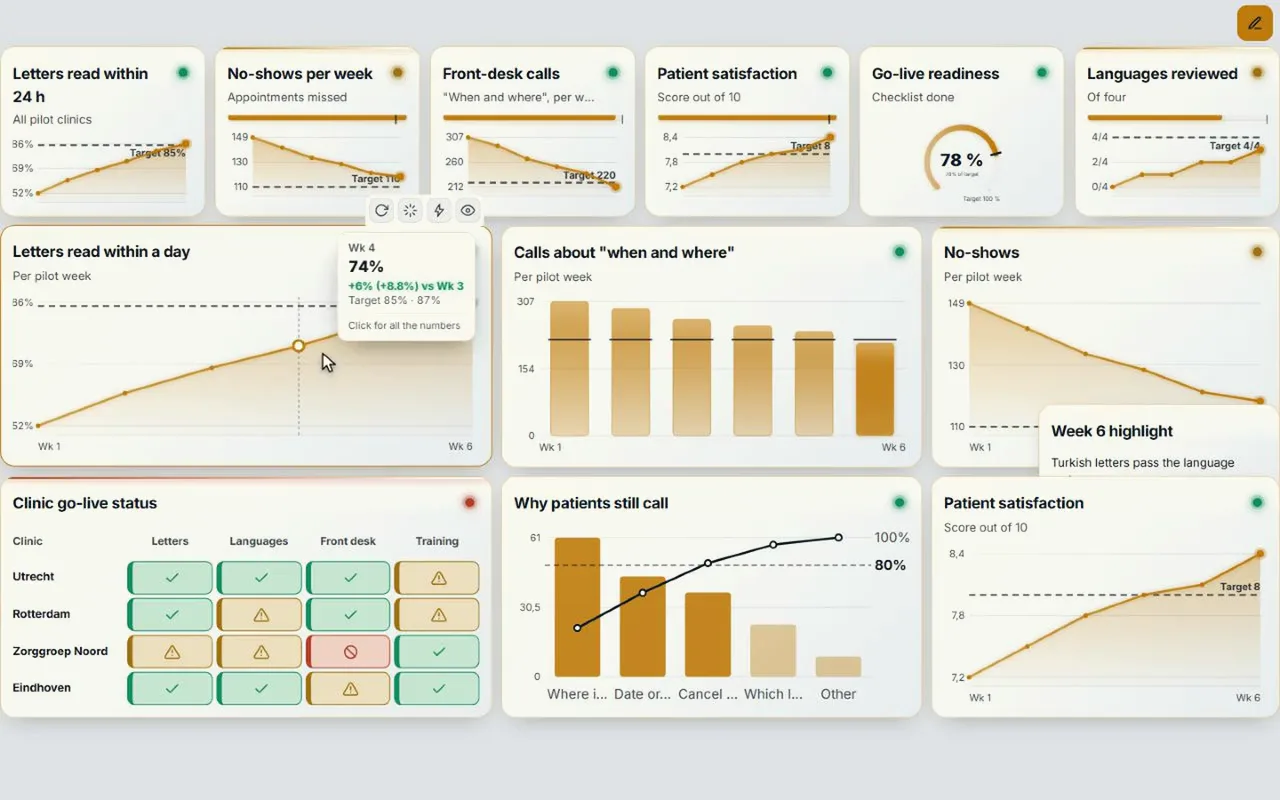
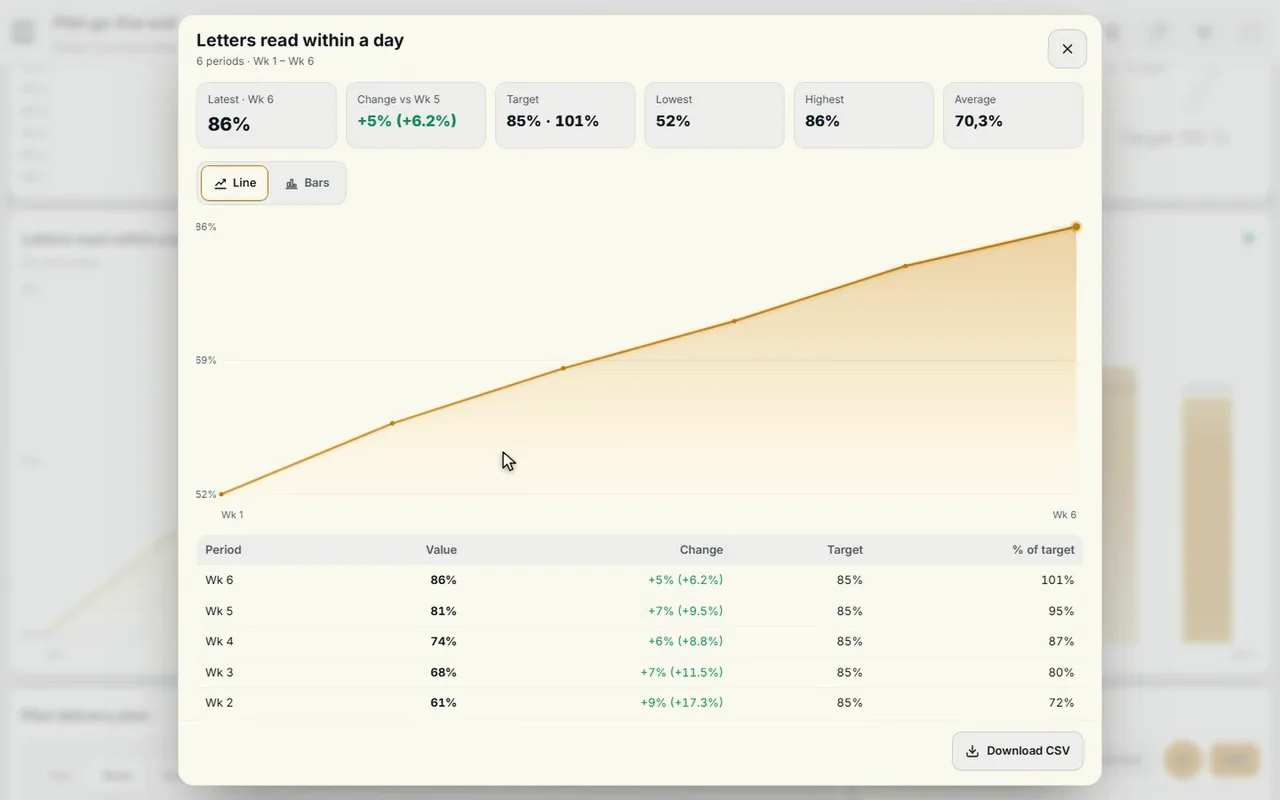
Each image below is a screenshot from CoVince’s Control Room, with demo data.
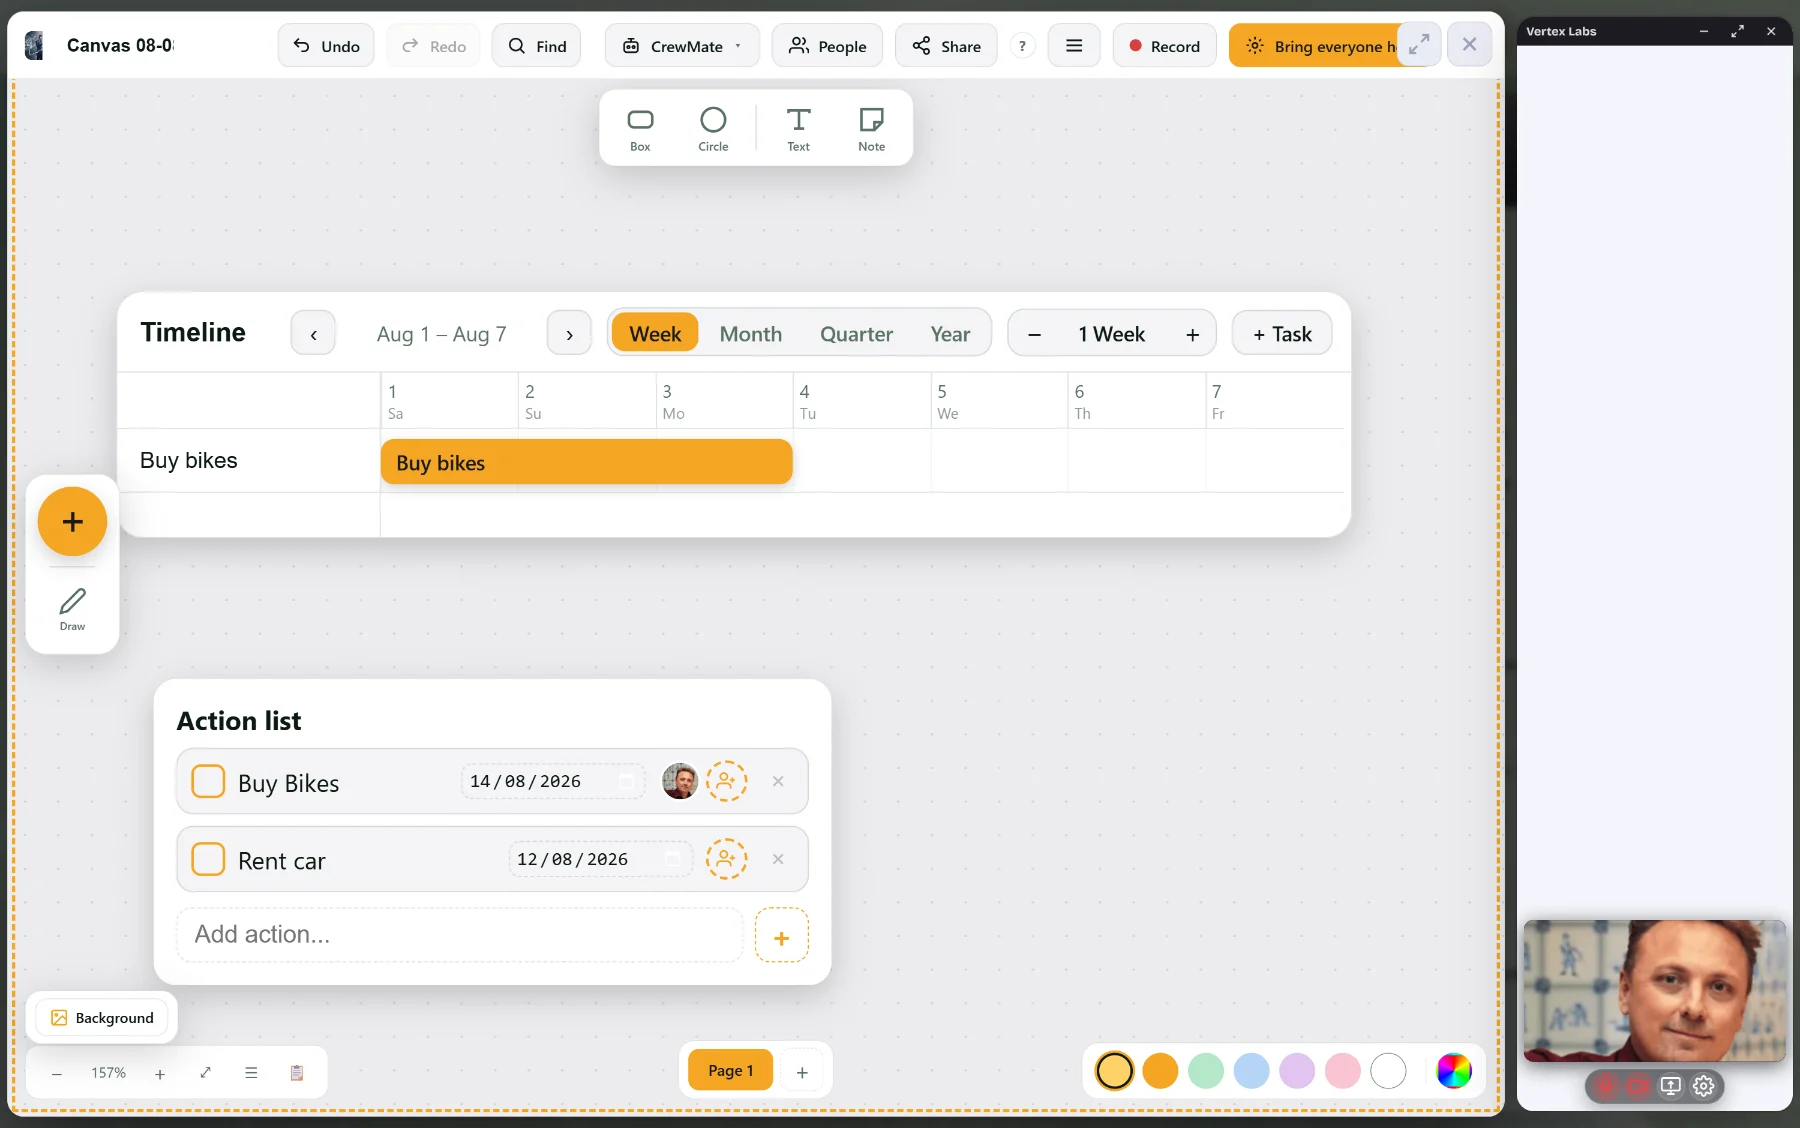
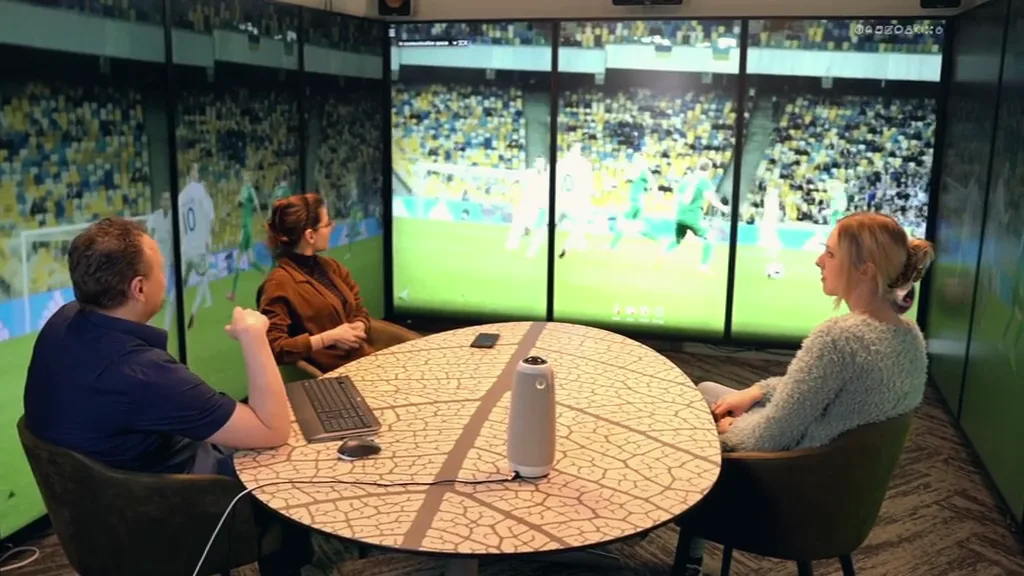
What a good KPI wall has in common
- Every KPI has a target. Without a target nobody knows whether 86 is good or bad.
- Every KPI has an owner. Someone who says: that is my number.
- Five to eight numbers per wall. More, and the team stops reading them.
- A colour and a trend. Green, orange or red, and the direction.
- An action for every red number. In CoVince you tap a chart and see which action is attached to it.
- Today’s numbers. A wall with outdated numbers is a notice board.
Example KPIs per sector
These are examples of topics to choose from, not norms and not target values. You decide the target and the source yourself.
Healthcare
| KPI topic | Why on the wall |
|---|---|
| Waiting time | Shows whether patients are helped faster |
| Staffing | Capacity against demand, per shift or ward |
| Cancelled appointments | Lost capacity, with the reason alongside |
| Lead time of a care pathway | Makes delay between departments visible |
More in Obeya in healthcare.
Local government and public sector
| KPI topic | Why on the wall |
|---|---|
| Lead time of applications | What citizens notice, per department |
| Progress per phase or neighbourhood | Programmes rolled out in steps |
| Open dependencies | What one department needs from another |
| Overdue actions | Ownership across departments |
More in Obeya in local government and the public sector.
IT and agile
| KPI topic | Why on the wall |
|---|---|
| Lead time | How long a ticket or feature is under way |
| Open incidents | The health of what is running |
| Availability | What users of the service notice |
| Dependencies between teams | What can block a release |
More in Obeya for IT and agile teams.
Construction and infrastructure
| KPI topic | Why on the wall |
|---|---|
| Progress per phase | Are we on schedule? |
| Open reports | What still has to be handled |
| Delivery times | What arrives late and what it hits |
| Completed work packages | How much is done |
More in Obeya in construction and infrastructure.
Manufacturing
| KPI topic | Why on the wall |
|---|---|
| Scrap | What comes off the line that is not good |
| Lead time | How long an order is under way |
| Delivery reliability | What the customer notices about you |
| Safety reports | What people on the floor see |
More in Obeya in manufacturing.
Education
| KPI topic | Why on the wall |
|---|---|
| Assignments handed in | Progress of a group, not of a person |
| Progress of a project | What is done and what still has to be |
| Open actions of the team | Ownership in miniature |
More in Obeya in education.
How to build one
- Per wall, pick five to eight KPI topics from the list above.
- Give each a target and an owner. Remove them if that does not work.
- Let the numbers come from CoVince, a CSV or a connected source, or type them in.
- Attach an action with owner and date to every red number.
With ‘Make with AI’ a short description becomes a proposal with pages, measurements with their source, phases and roles. Nothing is on the board before you press Build. For a fill-in sheet without a tool: Free Obeya template.
Frequently asked questions
Are the numbers in the images real?
No. The screenshots come from the CoVince Control Room with demo data.
Which KPIs should I choose?
Your team decides that itself. Pick five to eight numbers per wall, each with a target and an owner, and remove what does not drive a decision.
Where do the numbers come from?
From CoVince itself, from a CSV, from connected sources, or you type them in.
How do I see which action belongs to a KPI?
Tap a chart and you see which action is attached to it. Every action has an owner and a date.
Does the wall fit on a big screen?
Yes. The Control Room spreads over one, three or nine screens, and each screen gets a name.
What is visual management?
Visual management is the principle of making the state of affairs visible so nobody has to ask for it. A KPI wall and an Obeya are forms of it. See also Obeya vs Kanban, Scrum board and Visual Management.